


NFPCC Original Article: Executive Compensation Across Industries

MAJOR COMPONENTS (OR “BUCKETS”) OF EXECUTIVE COMPENSATION ARE FUNDAMENTALLY SIMILAR IN PUBLICLY TRADED COMPANIES ACROSS ALL INDUSTRIES.
We at NFPCC understand that although similar in function, there are certainly unique characteristics in every company’s respective compensation philosophy and pay programs. It is, however, worth mentioning that no matter how unique a company may be (i.e. industry), NFPCC has found more similarity among pay practices within public companies operating in different industries than not.
—
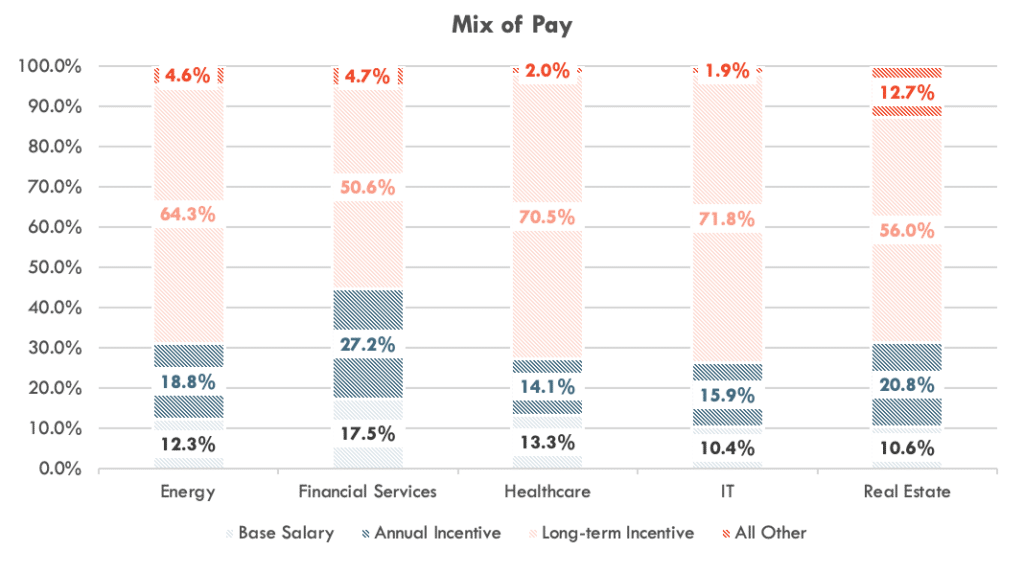
For example, base salaries are found to be closely aligned in terms of value at the median, while variable pay values varied due to company performance within their respective market. Interestingly enough, mix of pay ratios (or the percentage of each bucket compared to the whole) proved to be closely aligned, despite the difference in variable pay values, averaging 13% base salary, 19% annual incentives, 63% long-term incentives and 5% for all other compensation. In this study, NFPCC analyzed an array of companies operating in the Energy, Financial Services, Healthcare, IT and Real Estate industries to identify similarities and why we are seeing such close alignment with regards to executive pay.
Base Salary
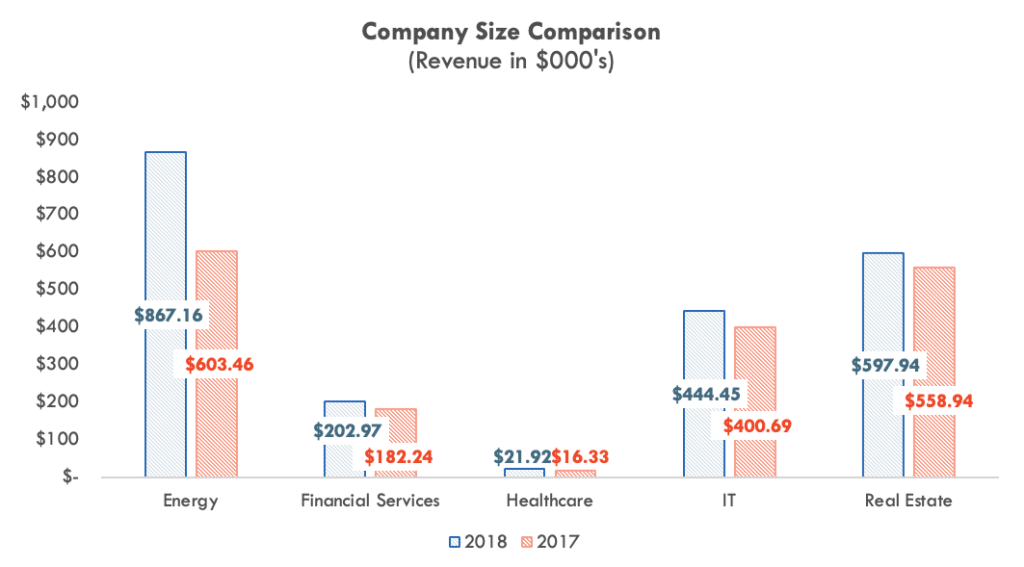
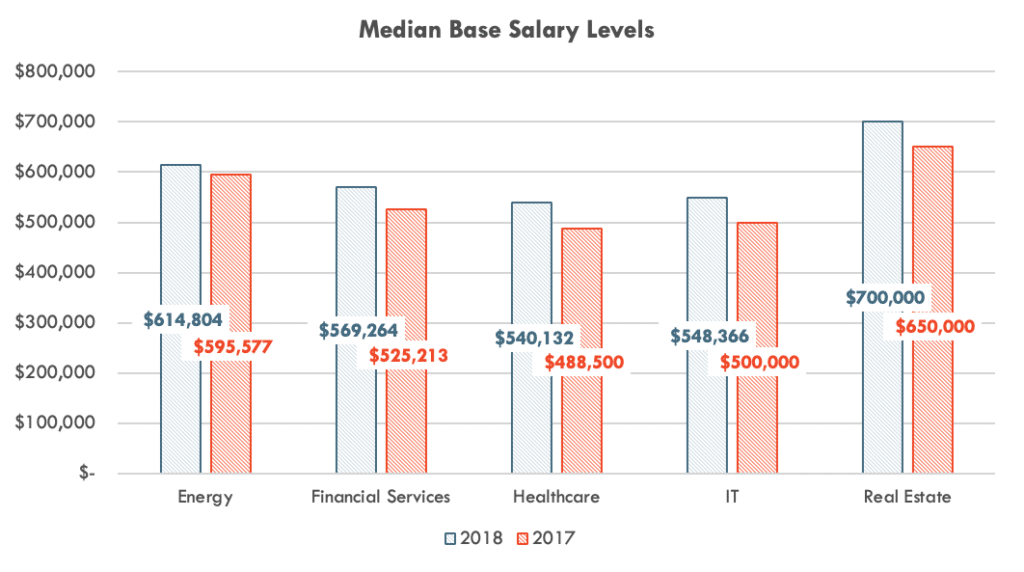
Base salaries are the foundational layer of compensation across all industries. Base salaries differ between companies and industries primarily based on a combination of company-specific factors and individual factors. Company-specific factors include the i) size, ii) complexity, iii) profitability, iv) life cycle and v) compensation philosophy of the respective organization. Individual specific factors include the pedigree and career stage of the incumbent. Based on NFPCC’s extensive research and data analysis, median CEO salaries are fairly consistent across all industries. Real Estate outpaces Energy, Financial Services, Healthcare, and IT companies in base salary compensation. Based on the size of company relationship, NFPCC fully expects Real Estate and Energy companies to have the largest base salary levels.
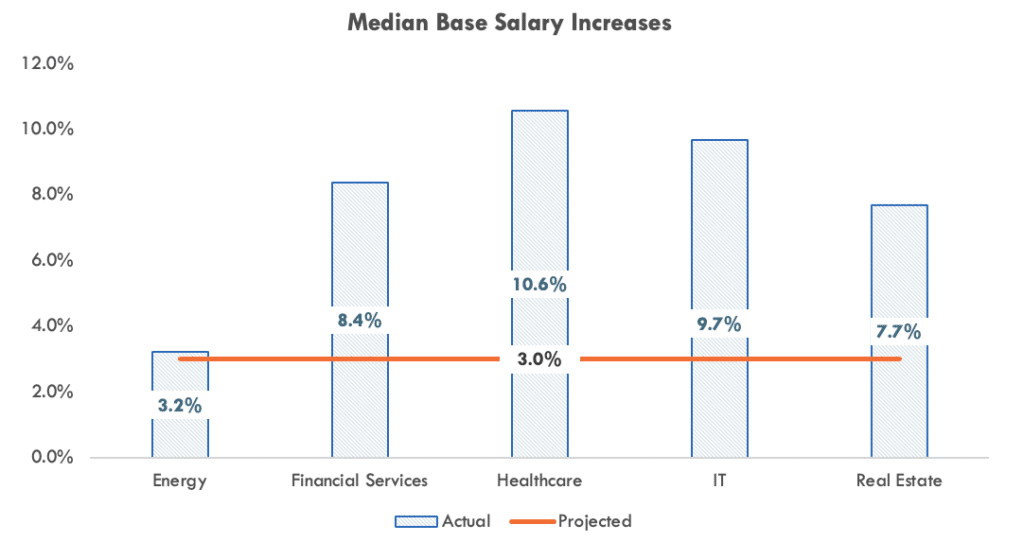
Further, base salary levels are predominantly adjusted year-over-year based upon prevailing market wages and cost of living adjustments. As detailed below, each industry projected salary increases of 3% year-over-year whereas each industry eclipsed this projection by 250% on average.
Annual Incentives
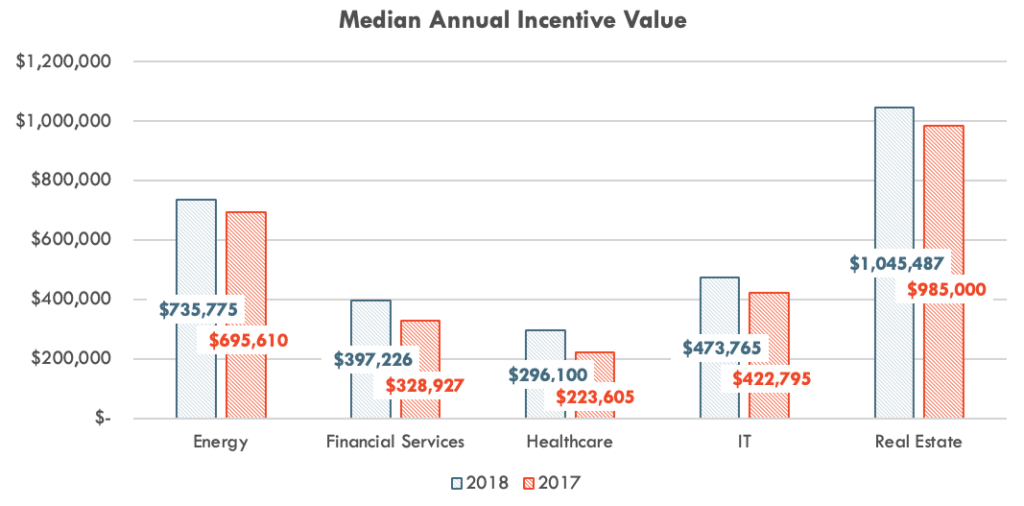
Annual incentives, commonly termed as bonuses, are viewed across all industries with threshold, target, and maximum levels of performance that function as a percentage of the CEO’s base salary levels. Due to the structure of annual incentive programs, the main differentiator to annual incentives is driven by the metric(s) that each respective company uses to measure performance and their correlation to individual company business objectives. Specifically, in Energy it is quite common to view production (relating to the ability to produce oil & gas) as a dominate measure within annual incentive programs, whereas Healthcare companies are utilizing patient quality. However, in general value proposition to the CEO, annual incentives remain fairly consistent on a year-over-year basis.
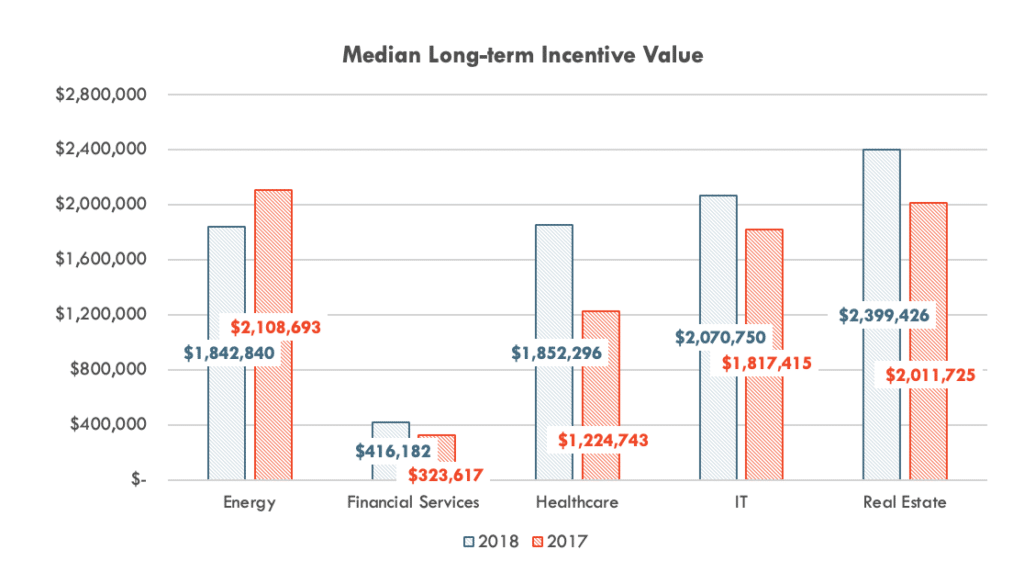
Long-Term Incentives
Before FAS 123R, stock options were the most widely utilized delivery vehicle for long-term incentives and were found across every industry. However, with the passing of FAS 123R in 2006 and the subsequent charge to earnings, stock options began to deteriorate within the marketplace with each passing year. Shortly thereafter, companies began to look for better alternatives. A majority turned to restricted stock due to its decreased dilution impact to shareholders and value retention even as stock prices began to fall during the Great Recession. In 2014, companies continued their respective evolution and looked to gain even more efficiencies companies. With these efficiencies in mind and shareholder viewpoints, which were now stronger than ever, performance shares began to eclipse restricted stock as the preferred method of aligning executives with shareholders. These performance shares are most typically measured as total shareholder return, most often times on a relative basis to industry peers with an emerging trend to utilization of index groups, (i.e. S&P 500). And when used in conjunction with restricted stock awards, a company can maximize its ability to motivate and retain.
From a value of award and delivery perspective across all industries, companies have begun to utilize targeted grant date fair value rather than historical approaches such as fixed number of shares and/or a percentage of base salary. This effort is a byproduct of volatile stock price environments and constantly moving base salaries. Shifting to this methodology of awarding long-term incentives has provided companies an ability to more accurately predict and compare their compensation packages to their peers, while not allowing for “extraordinary” events to create potential windfalls and/or extreme loss of value. Lastly, the value of award year-over-year tends to follow market sentiment. Due to continued stock price valuation pressures within Energy over the past four years, Energy companies have reduced long-term incentive awards with i) an eye for the future and positive stock price bounce back, and ii) share-burn rates and absolute number of shares being delivered.
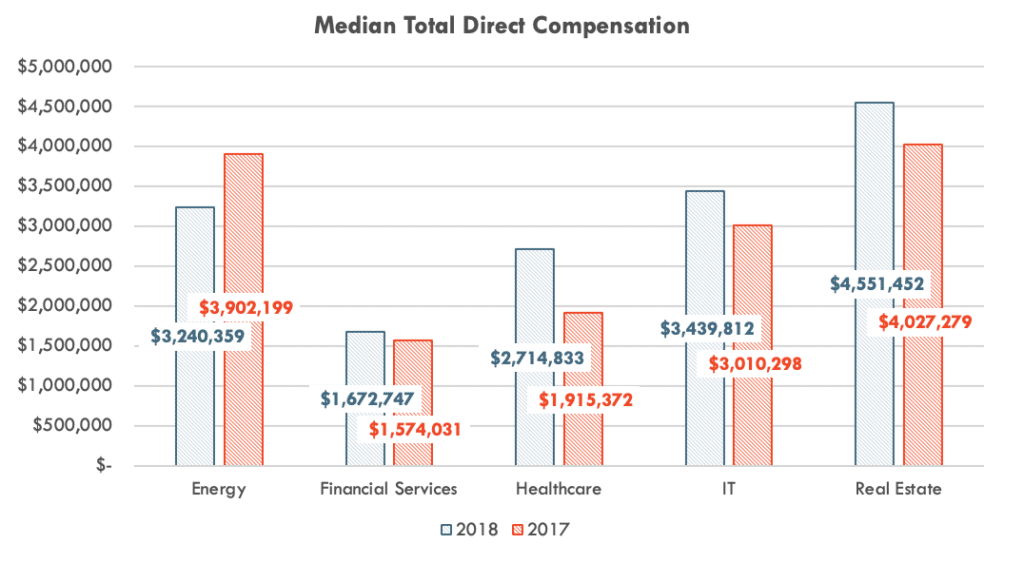
Total Direct Compensation
Total direct compensation is simply the summation of base salary, annual incentives, long-term incentives, and all other compensation. Across all industries, year-over-year compensation has continued to increase, with Energy being the lone exception. Specifically, as mentioned above, Energy’s reduction in long-term incentive awards has decreased its respective total reported compensation even while its growth in revenue has far outpaced its counterparts.
Conclusion
Each industry is different in their respective measurable performance characteristics; specifically relating to their annual incentive programs. However, each industry is comparable in the root purpose of their compensation programs. These programs are meant to attract, retain and motivate their employee population to drive long-term organizational stability and viability while providing shareholders returns. Further, the largest companies within a given industry will scan multiple industries, as well as the S&P 500, with tangential overlap to identify best practices for potential implementation in their respective programs. The key driver in the development of the most effective programs is a delicate balance between general best practice and what is practical from an application standpoint. This strategic design aspect of compensation programs is what truly separates the best-performing companies from their counterparts, while each company across each industry relies on the same instruments to administer their respective programs. The following image illustrates the relationship of each component of compensation as a percentage of the respective total. A few final key points share consistency across all industries:
- Fixed compensation (base salary) occupies the smallest percentage of overall compensation
- Variable at-risk compensation (annual and long-term incentives) combined, occupies 75% of compensation
- Long-term compensation, in every industry, accounts for more than 50% of annual compensation, of which remains highly dependent on share valuation fluctuation over a three to five-year period
Don’t hesitate to contact NFP Compensation Consulting if you have any questions regarding your executive pay programs. We’ll provide expert guidance and work with you to develop an effective compensation plan aimed at maximizing performance and creating value.
